


TL;DR. Positive behaviour support is a data-based science, and the quality of every decision rests on the quality of the data. That starts with the functional behaviour assessment, where you work out why a behaviour happens. Good practice means being objective, using validated tools such as the QABF, FAST and MAS alongside ABC observation, matching the measure to the behaviour rather than the other way around, setting a baseline so you can prove change, and avoiding common traps like running ABC charts forever or trusting a QR code to do the thinking. Good data is useful data, even when it is anecdotal.
We talk about data constantly in positive behaviour support, and for good reason. Without it, we are working from assumptions, opinions and our own biases. With it, we can say why a behaviour happens, whether a strategy is working, and whether a participant is actually making progress. As the physicist Lord Kelvin put it, “when you can measure something and put it into numbers you know something about it, and when you cannot, your knowledge is thin”. In PBS, the data is the science. Without it, we are telling a story based on assumptions.
This article is a practical look at collecting and using meaningful behaviour data, starting with the functional behaviour assessment. It is the first part of a short data series.
What is a functional behaviour assessment, and why does the data matter so much?
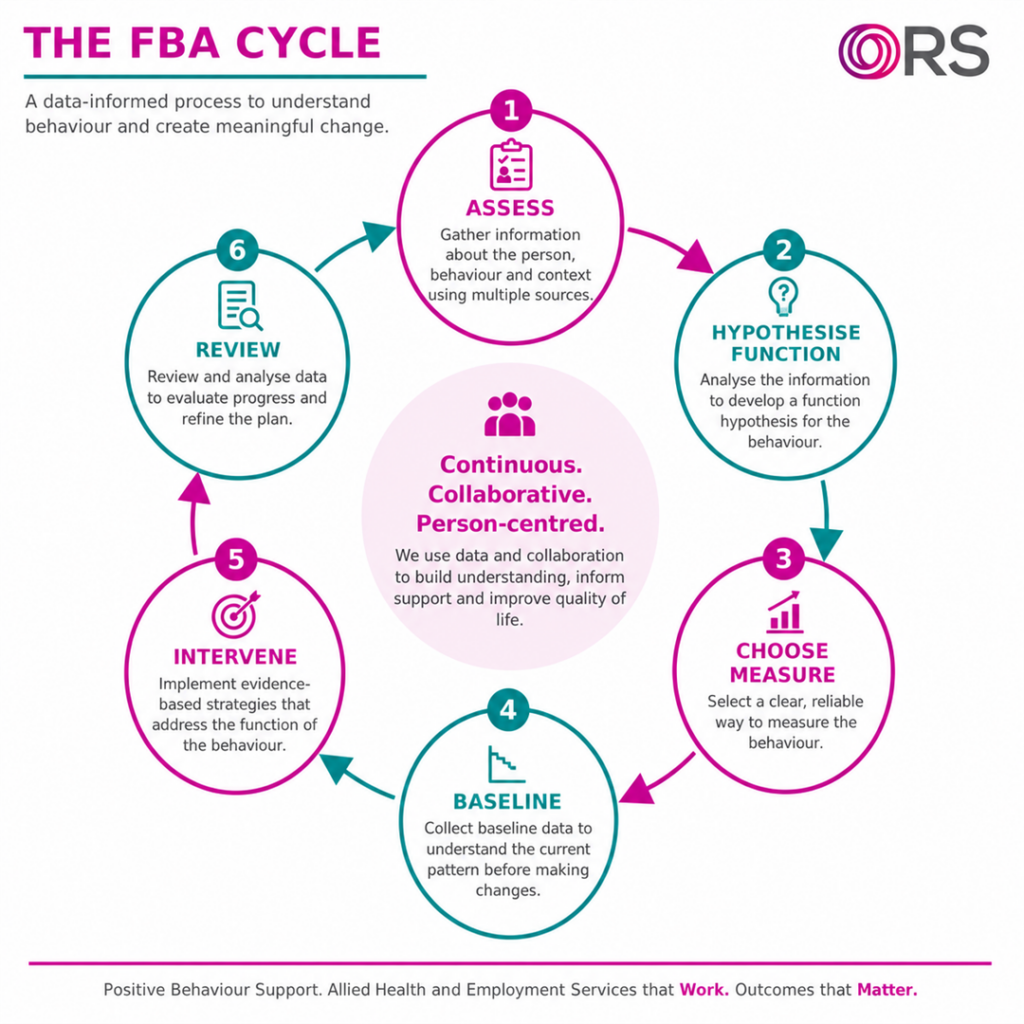
A functional behaviour assessment, or FBA, is the process of working out why a behaviour of concern happens: the triggers, the patterns, and the purpose the behaviour serves for the person. Understanding that function is the backbone of positive behaviour support. Without it, interventions are often ineffective or simply wrong, because you are guessing at the cause.
This is why data quality matters from the very start. If the FBA data is poor, the error cascades through everything that follows. Miss the triggers, misjudge the frequency, or look only at how often a behaviour happens when the real story is how intense it is, and the strategies you choose will not fit the person in front of you. Strong data supports objective decisions, accurate assessment, safer risk management, ethical practice, and accountability to the participant, their stakeholders and the NDIS.
It is worth remembering that the NDIS requirement to collect data is not arbitrary. It is drawn from decades of evidence in behaviour science. When the rules say data is fundamental to PBS, there is a long research base behind that. The NDIS Commission’s guide to behaviour support assessment sets out the same expectation.
Start with validated functional assessment tools
A good FBA draws on more than a conversation. Interviews and the information you gather during assessment matter, but what someone tells you and what a structured tool reveals can be two very different things. Validated functional assessment tools give you a tested, reliable and consistent read on the function of a behaviour.
Three that belong in everyday practice are the QABF (Questions About Behavioral Function), the FAST (Functional Analysis Screening Tool) and the MAS (Motivational Assessment Scale). They are straightforward to complete, and they have been tested and retested for reliability and validity. Used alongside observation, they move you from an educated guess to an evidence-based hypothesis about why a behaviour occurs. That hypothesis is what should drive your strategy selection, not a hunch from a single interview.
ABC data is powerful for assessment, not for monitoring forever
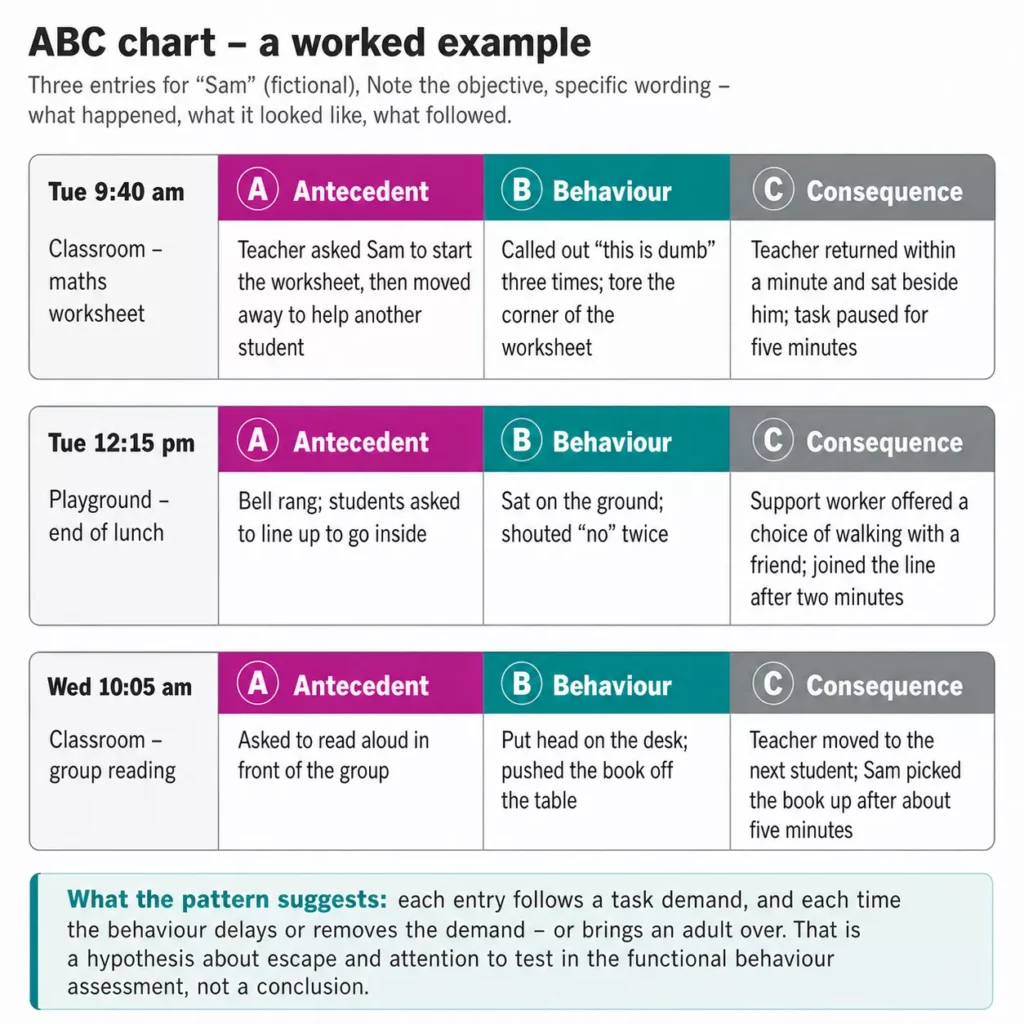
ABC recording, which captures the Antecedent, the Behaviour and the Consequence, is one of the most useful tools you have, and one of the most overused. It is descriptive, so it is ideal early in an assessment: when a behaviour is unfamiliar or unclear, when you are identifying antecedents and consequences, when several functions are possible, or when you need qualitative context.
Once you have a clear, testable hypothesis from the FBA and the function is confirmed, ABC has largely done its job. Because it is descriptive, it is not sensitive to change and it will not demonstrate progress over time. Keeping it running through the whole servicing cycle creates real problems:
- Data overload that leads to no action, because no one knows what to do with pages of repetitive description.
- Staff fatigue and rushed, poor-quality recording.
- Duplicated work, since incident reports often already capture the same antecedent, behaviour and consequence.
- Delayed intervention, when the focus stays on collecting rather than acting.
- A false sense of progress, where the box marked “data collected” is ticked but there is no outcome data to show change.
The takeaway is simple. ABC is for understanding behaviour, not for monitoring it indefinitely. Once you understand the behaviour, switch to a measure that can actually show whether it is reducing.
Match the measure to the behaviour, not the other way around
| Measure | What it captures | Best used when |
|---|---|---|
| Count and frequency | How often a behaviour occurs (frequency adds time, for example, per hour or per day) | The behaviour is discrete with a clear start and end, and you want to compare across time, people, staff or shifts. |
| Duration | How long a behaviour lasts | The behaviour varies in length or is continuous, for example the length of an escalation or time to return to baseline. |
| Latency | Time from an instruction or event to the behaviour | There is avoidance or escape, for example a delay before taking medication, where the count may stay the same while latency drops. |
| Magnitude or intensity | The force or severity of the behaviour | The behaviour is high risk, using a clear rating scale so everyone measures the same way. |
| Topography | The physical form, or what the behaviour actually looks like | You need to define a vague label such as “tantrum”, or compare how a behaviour looks across settings. |
| Inter-response time | The spacing between behaviours | Behaviours form an escalation cycle and you want to track the gap between them. |
| Percentage or goal-based | Steps completed, often via a task analysis | You are tracking skill acquisition or progress towards a goal. |
Two points are easy to miss. First, the same behaviour can be measured in more than one way depending on what you want to know. A child calling out could be counted for frequency, timed for duration, or scored for percentage of appropriate responses. Second, a reduction in intensity is progress even when frequency stays the same. If a participant still escalates ten times when told ‘no’, but the escalations move from damaging property to a brief raised voice, that is genuine improvement, and only an intensity measure will show it. A clear rating scale helps here, and many clinicians find their existing escalation table already works as one.
How to choose the right measure
Once you are looking at the behaviour first, a few questions guide you to the right measure.
- Why am I collecting this data? Purpose drives the measure. Monitoring change over time, tracking mastery of a skill, evidencing behaviour reduction and evaluating intervention effectiveness each call for different measures.
- What do I want to know? The same behaviour tells you different things depending on the question you are asking.
- What is the context and environment? Different settings allow different measures. Noise, staffing, resources and the skill of the team all shape what can realistically be recorded.
- What is the function of the behaviour? The measure should align with why the behaviour happens. Attention-maintained behaviour may suit frequency, while escape or avoidance may be better captured by latency or duration. Remember the same behaviour can have different functions in different contexts.
- Is it feasible with the resources available? Staff time, tools and training all matter. A measure that is too complex will not get buy-in, and complex tools without training produce unreliable data. A method that asks a busy parent or a lone group-home worker to stop and scan a code every time may simply not be realistic.
Set a baseline so you can prove change
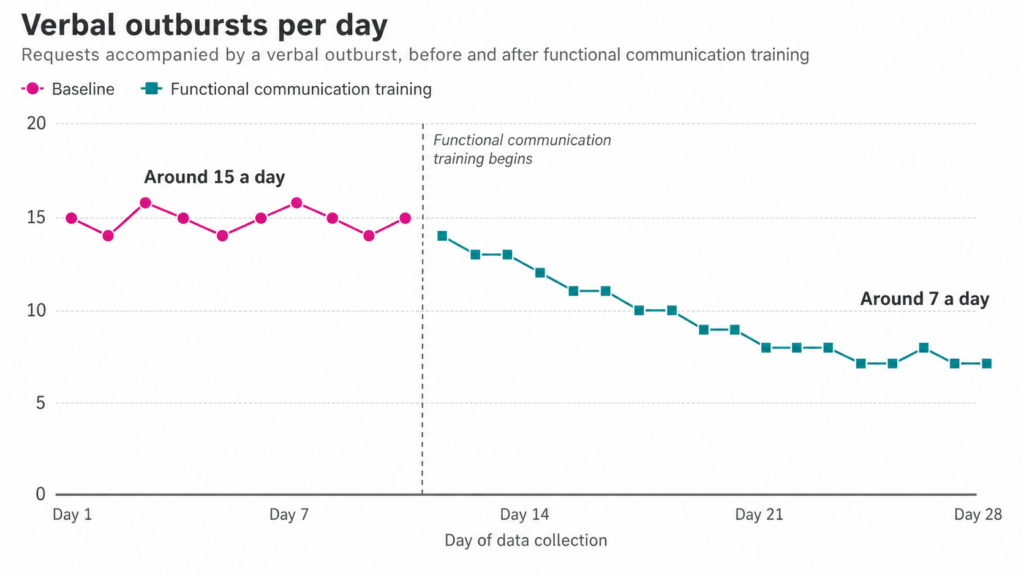
Effectiveness data depends on a clear before-and-after, and that means a baseline. During the FBA, once you have identified the behaviour and completed your functional assessment, choose the best measure and gather solid baseline data while you finish the rest of your assessment. Then, at the annual review, you can compare like with like.
The payoff is some of the most valuable data in clinical practice. To use a simple illustration, you might record that requests with verbal outbursts were occurring around fifteen times a day at assessment, and after functional communication training they have reduced to around seven a day. That kind of clear, measured change is exactly what demonstrates the value of your work.
The QR-code trap and using real-world data
QR codes can streamline collection, but they can also create a false sense of accuracy. The code is not the measure. What matters is what you are asking it to capture, and whether those questions still fit the stage you are at. FBA-stage questions about the setting, what happened and how staff responded are not relevant six or nine months into implementation, when you should already know that. Leaving them in place produces pages of data that no longer tell you what you need, which is data overload, not insight.
Beyond the tool, hold on to one principle: good data is useful data. Format matters far less than quality and consistency. Real-world data arrives as incident reports, shift notes, text messages, emails, photographs of property damage, spreadsheets and plain anecdotal observation. A practitioner can extract a lot from a simple incident summary: counts and topography of behaviours, likely triggers, and patterns across dates and times. The skill is to sit with it, ask what it tells you and what you want to know next, and turn that into a clinical step, such as coaching a particular staff member on how they prompt during personal care.
Anecdotal data counts too. Rather than dismissing “there has been a big reduction,” get curious and add parameters. Roughly how often did it happen before, and how often now? Documented and quantified even loosely, that is real, usable data.
Good data, better decisions
PBS decisions should be grounded in evidence, and that evidence starts with a solid functional behaviour assessment, the right measure for the behaviour, a baseline to measure against, and pragmatic collection that works in the real world. If you take two things from this, take these. Match the measure to the behaviour, not the behaviour to the measure. And use ABC to understand a behaviour, not to monitor it forever.
Refer to ORS. If you are supporting someone with behaviours of concern and want the assessment and the data done properly, our positive behaviour support team works with participants, families and support coordinators across Australia. Referrals and enquiries are welcome.
Work with us. If this is how you like to practice – curious, evidence-led and honest about what the data does and does not show – you would fit in well here. Read about becoming a behaviour support practitioner or feel free to send your quick apply below.
Frequently asked questions
What is a functional behaviour assessment?
A functional behaviour assessment, or FBA, is the process a behaviour support practitioner uses to work out why a behaviour of concern happens. It looks at the triggers, the patterns and the function the behaviour serves, so that support strategies target the real cause rather than guessing at it.
What functional assessment tools are used in PBS?
Common validated tools include the QABF (Questions About Behavioral Function), the FAST (Functional Analysis Screening Tool) and the MAS (Motivational Assessment Scale). They are reliable, valid and quick to complete, and they are used alongside observation and ABC recording.
How long should I use an ABC chart?
Use ABC recording early, while you are still working out what a behaviour looks like and identifying antecedents, consequences and possible functions. Once the function is confirmed through the FBA, ABC has done its job. It is descriptive and does not show change, so prolonged use tends to create data overload rather than insight.
What is the difference between frequency and intensity data?
Frequency captures how often a behaviour happens, while intensity captures how severe it is. They can move independently. A behaviour can occur just as often while becoming much less intense, and that reduction in intensity is real progress that only an intensity measure will reveal.
Does anecdotal data count in positive behaviour support?
Yes. Good data is useful data, regardless of format, as long as it is accurate, consistent and meaningful. Anecdotal observations from families and support workers are valuable, especially when you get curious and add rough parameters such as how often a behaviour happened before compared with now.


