


TL;DR. In positive behaviour support, success is not just fewer incidents. The purpose of PBS is a better quality of life, so outcome measures need to look beyond behaviour reduction to skills, participation, choice and control, restrictive practice reduction and quality of life. A useful way to organise this is the outcome pyramid: behaviour change at the base, then implementation outcomes, then quality of life at the top. Set a baseline, choose measures that fit the goal, involve the person and their family, and write the outcomes through every relevant section of the behaviour support plan, not just the behaviour table.
This article continues a short series on data in PBS, following the pieces on functional behaviour assessment and data for restrictive practices. Here the focus is outcomes, and the central idea is simple: a drop in behaviour, on its own, is a thin measure of whether positive behaviour support is working.
Why behaviour reduction alone is not success
The primary purpose of positive behaviour support is to improve a person's quality of life. Reducing the risk of harm and behaviours of concern matters, but it sits in service of that larger purpose. Once you hold that order, the limits of behaviour data become clear. A behaviour can stay at the same level for twelve or twenty-four months while a person's quality of life improves a great deal. And a behaviour can fall while quality of life gets worse.
Picture a plan that reports a ninety per cent reduction in property damage. If the same person is now spending most of the day alone in their room and has stopped attending the community, that is not success, it is a different problem. So whenever a behaviour reduces, the useful habit is to ask why. Did the person develop new skills, or was access simply restricted? Is a restrictive practice still doing the work? Has the behaviour reduced, or just changed form?
There is an accountability angle too. In the NDIS context, demonstrating that supports are effective, and advocating for the funding a person needs, both depend on being able to show outcomes beyond behaviour reduction. If a progress report only says the behaviour still occurs five times a day, it misses everything else that has changed.
The dimensions of a meaningful outcome
Outcomes worth measuring span several dimensions: genuine behaviour change paired with replacement skills, skill development, participation and engagement, relationships and social connection, choice and control or self-determination, a reduction in restrictive practices over time, and quality of life itself. Stakeholder outcomes belong here too, such as improved staff or carer confidence, skill, and consistency. In some cases those are the first outcomes to target, because without consistent implementation, progress for the participant tends to be slow.
The outcome pyramid
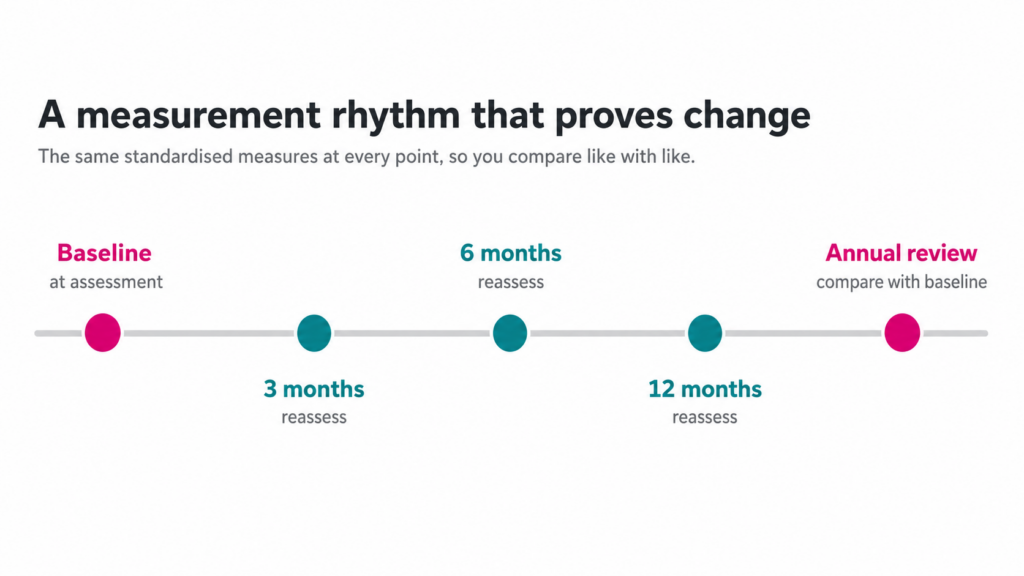
A simple way to organise outcomes is a three-level pyramid.
At the base sits behaviour change. It is the easiest to measure and the most common focus, but reduction alone does not demonstrate success. Always look at the replacement skills and the broader skill acquisition, coping, regulation and tolerance that should be growing alongside any reduction.
In the middle sit implementation outcomes: staff confidence, fidelity, consistency of implementation, and stakeholder skill and resilience. You cannot expect an intervention to work if it is not being delivered as intended;improvements at this level often appear before participant outcomes do. This is why a good first question for a behaviour support practitioner, when a strategy “isn't working,” is to ask to see it implemented. Data here tells you whether a lack of progress is about the intervention itself or about how it is being delivered.
At the top sits quality of life: choice, participation, relationships, independence, community access and inclusion. This is the most meaningful tier, the reason positive behaviour support exists, and, honestly, often the hardest to measure.
Looking beyond the numbers
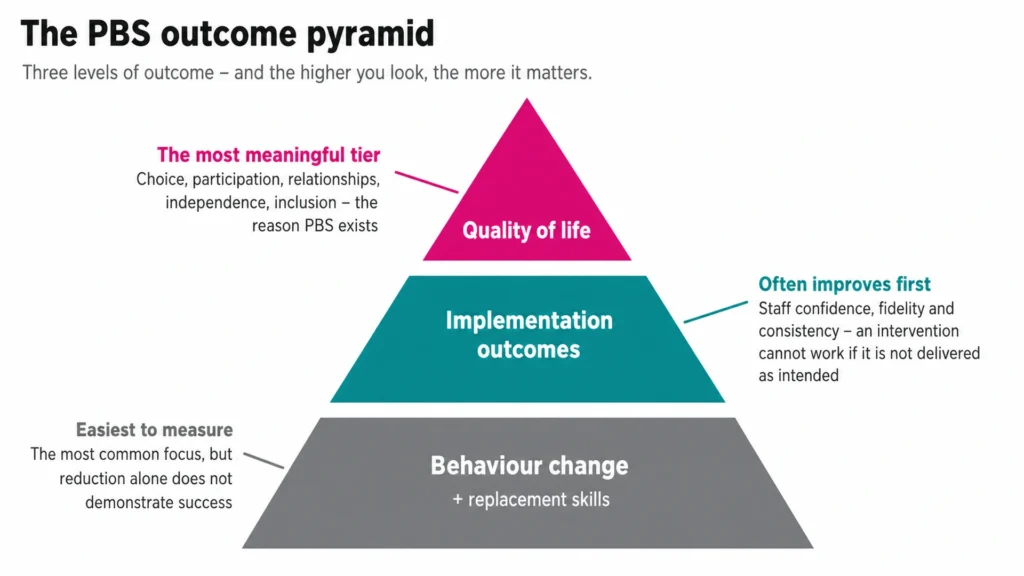
When you see a change in the data, it is worth probing it from several angles. Has the behaviour genuinely reduced, or changed form? Has the function been addressed, or just blocked? Are replacement skills growing? Is the plan being implemented with fidelity? Was any gain achieved through greater restriction? What does the person themselves say about the change? Does it generalise across settings and people, or only appear in one place? Will it be sustained if staffing changes, which is a point worth making in progress reports when ratios are under pressure. Are you still measuring the right thing, given the behaviour may have changed shape? And has anything worsened, such as isolation or withdrawal, as an unintended consequence?
How to measure outcomes
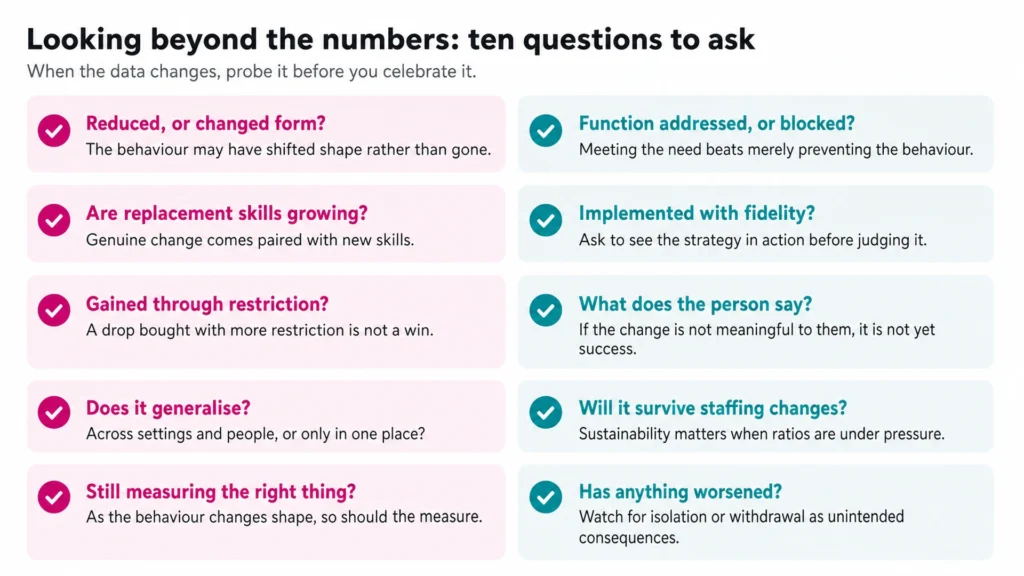
At a minimum, use standardised measures consistently, with a baseline at assessment and reassessment at three, six and twelve months and every annual review. Commonly used tools include the Strengths and Difficulties Questionnaire, the Kessler K10, the Developmental Behaviour Checklist for children, and quality of life measures such as the WHOQOL. Where families or carers are under significant stress, a caregiver burden measure can document real, positive change too, since reducing carer strain tends to ripple through to better outcomes for the person. The NDIS Commission's Compendium of Resources lists many validated tools and notes which suit initial assessment and which suit outcome measurement.
Day to day, a great deal can be counted and observed: time spent engaged in an activity, peer interactions and new friendships, community participation such as shops and appointments, and daily living skills broken into achievable steps. A reduction in prompts is a particularly useful gauge, and it works across all skill levels, including for people with higher support needs.
Two principles keep this honest. First, as goals change, the data tools must change with them, a thread that runs through the whole data series. Second, measure with a strength-based lens and look for social validity: what the person can do more of, what they take part in more fully, what is becoming easier, safer or more independent. Involving the person and their family matters, because if the people around someone do not see the change, it is not yet meaningful to them. A simple person-centred “good day, bad day” reflection, revisited over time, captures exactly that kind of meaningful change.
Writing outcomes into the behaviour support plan
Outcomes belong throughout the plan, not in a single section. The risk of harm table speaks to behaviour reduction. The history of behaviour and intervention, and the proactive strategies section, are where you report what the person actually learned against the skills you set out to teach a year ago. The restrictive practice table and rationale should be rewritten at each annual update with current behaviour and outcome data at the forefront, so the case for whether a practice is still needed, or can fade from routine to as-needed use, rests on evidence. And the goals section, where the priorities you set should reflect what has changed.
Across all of it, show both risk reduction and positive change. Describe what the person can do now, even if a skill is not fully mastered, because some gains are better than none. Start from a baseline of where the person was and where they are now, then compare over time and across settings and people. A clear outcome statement names what changed, by how much, over what period and in what setting, and, at its best, shows the skill generalising across environments.
Common pitfalls
A handful of traps come up again and again: measuring only behaviour reduction; setting goals so big they cannot be evidenced; collecting data that is too hard for staff to gather or not fit for purpose; assuming more data is better data; not involving the client and family; not reviewing the data regularly; and failing to link the outcomes back to quality of life. If the data is piling up and feels overwhelming, that is a supervision conversation, not a reason to avoid it until the annual review.
Refer to ORS. If you are supporting someone and want behaviour support that measures what matters – skills, participation and quality of life, not just fewer incidents – our positive behaviour support team works with participants, families and support coordinators across Australia. Referrals and enquiries are welcome.
Work with us. If this is how you like to practise – outcomes-focused, person-centred and honest about what the data shows – you would fit in well here. Read about becoming a behaviour support practitioner or if you're looking for a career that rewards clinical excellence, apply below via quick apply
Frequently asked questions
What are outcome measures in positive behaviour support?
They are the evidence of whether supports are actually improving a person's life. Good outcome measures look across several dimensions, including behaviour change, skill development, participation, choice and control, restrictive practice reduction and quality of life, not behaviour reduction alone.
Is behaviour reduction enough to show PBS is working?
No. The purpose of PBS is to improve quality of life, so behaviour reduction is only part of the picture. A behaviour can reduce while quality of life falls, for example, if the person becomes isolated, and a behaviour can stay the same while quality of life clearly improves.
What is the PBS outcome pyramid?
A simple model with three levels. Behaviour change sits at the base, implementation outcomes such as staff confidence and fidelity sit in the middle, and quality of life sits at the top as the most meaningful outcome and the reason PBS exists.
What outcome measures can I use?
Standardised tools used consistently with a baseline, such as the Strengths and Difficulties Questionnaire, the Kessler K10, the Developmental Behaviour Checklist and quality of life measures, plus a caregiver burden measure where relevant. Day to day, count things like engagement time, participation, independence and a reduction in prompts.
Where do outcomes go in the behaviour support plan?
Throughout the plan, not one section. They belong in the risk of harm table, the history of behaviour and intervention, the proactive strategies, the restrictive practice table and rationale, and the goals, so the plan shows both risk reduction and positive change.


